Software can also be developed for other tests such as zero-scale error, full-scale error, and gain error. This however requires a software servo loop and is a topic for another application note.
The analysis software is a universal program that can be used to analyze the data for any ADC. Below are example screens of the software.
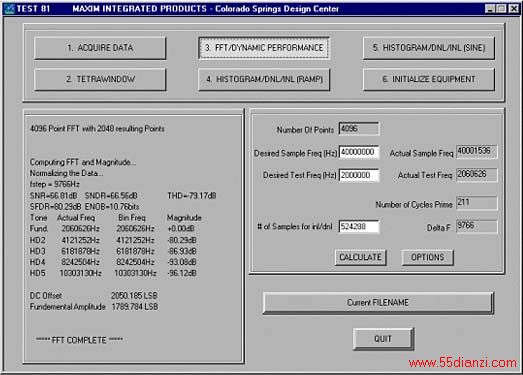
Figure 2. Screen for Test81.
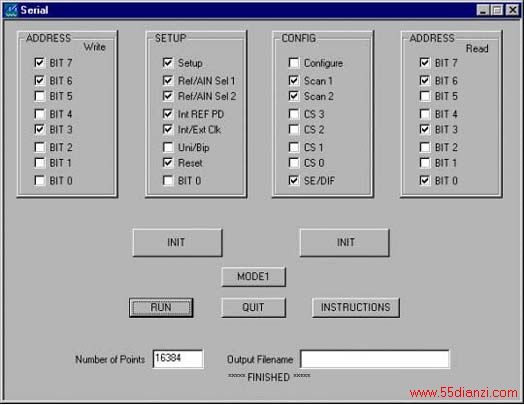

Figure 3. Screens for control.
Operation
To perform an FFT or test for INL or DNL, the test frequency and sample frequency must be properly selected to insure: (1) that all digital codes in the converter are exercised, and (2) that the signal-to-noise and harmonic distortion measurements are not compromised by the test methodology. Using the prime number approach, a prime number of test-tone cycles is acquired, which results in no discontinuity between the data endpoints.This method produces a spectrally pure result, where the test-tone and harmonics are each contained in one frequency bin. That is, an FFT has discrete frequency bins of finite bandwidth. Properly selected sample and test-tone frequencies result in all the energy from the test-tone appearing in a single frequency bin. It is important that the conversion clock generator and test-tone generator be synchronized for coherent testing.
For example, given a sample frequency fSAMPLE=100ksps, a test-tone frequency fTEST= 1kHz, and the number of points acquired, N=4096, we can determine what frequencies should be used. The bandwidth of each frequency bin is given by fSAMPLE/N=24.41. Round this result up this to 25Hz. Now recalculating the sample frequency yields 25 × N=102.4ksps. To determine the test-tone frequency, start with fTEST/25=40. Choose the closest prime number to 40, which is 41. This yields a recalculated test-tone frequency of 41 × 25=1025Hz. Note that fTEST is a rational number and can readily be loaded into most signal generators. An irrational number would cause leakage in the FFT and lead to an erroneous SNR. A single-sided FFT will have 2048 (N/2) bins. Given that each bin is 25Hz wide the FFT should extend to 51.2kHz, which is exactly fSAMPLE/2. All the test-tone energy should be in the 41st bin or at 25 × 41=1025Hz.
The function generator used for the test frequency should have low distortion. If a low distortion signal generator is not available a filter can be used to reduce harmonics.
Use the following steps to complete the data collection process:
- Click the INIT button so that the logic analyzer and pattern generator can be set up.
- Enter a filename where the conversion data will be stored.
- If necessary, select the resolution of the converter being tested. This is usually set up to default to the proper value.
- Select the number of points in the FFT or number of conversions.
- Click the "RUN" button. At this point the program will set the converter up, begin conversions and capture the desired amount of conversion data. The data will then be saved in the desired file.
After the data has been saved, the file can then be loaded into Test81 or any other program that computes the desired information from the raw conversion data.
The FFT results can be plotted showing various harmonics or spurs associated with the measurement. In addition, the dynamic performance numbers are shown in the control WINOOW and on the plot. These include the SFDR, SNR, SINAD, THD, and ENOB. Each harmonic (up to the fifth) is denoted along with the frequency and relative level.
The INL and DNL can be computed using a linear ramp signal at the ADC input or using the sine histogram method. The sine histogram method has the advantage of using a clean sinusoid rather than having to generate a highly linear ramp. For applications with AC input signals, the sine histogram method is a better barometer of ADC performance because it provides test data for AC inputs, unlike some converters that are only tested with DC input signals.
To set up the sine histogram INL/DNL tests, run the prime cycle calculation. This insures that all the code bins will be exercised and the overall histogram will have a sinusoidal probability distribution¹. The converter should be slightly overdriven. This will overfill the first and last bins of the histogram, but this data is thrown out. The offset and gain is automatically calculated and the DNL and INL plots are produced.
Below are example plots plotted with Gnuplot.
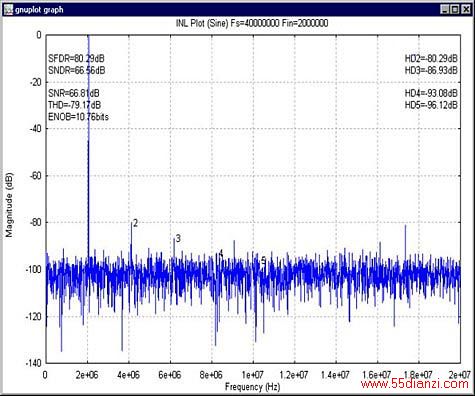
Figure 4. Dynamic performance (FFT) Plot.

Figure 5. Histogram plot.
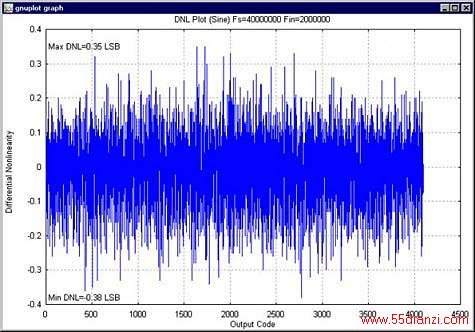
Figure 6. DNL plot.
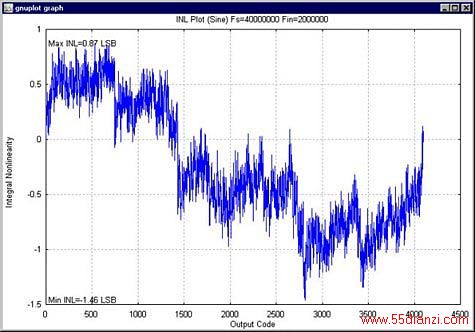
Figure 7. INL plot.
1. J. Doernberg, H.S. Lee, D.A. Hodges, "Full-Speed Testing of A/D Converters," IEEE J. Solid-State Circuits, vol. SC-19, no.6, pp. 820-827, Dec. 1984.
上一页 [1] [2]
本文关键字:数据采集 电工文摘,电工技术 - 电工文摘